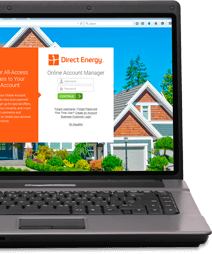
How does the Direct Your Energy Usage Graph work?
Within the Direct Your Energy dashboard, you will see a graphical depiction of your energy usage that measures usage per month against the average temperature per month in your zip code. It will allow you to see when and how much electricity you consume, and what the weather condition was in your zip code that may have influenced your usage.
Want to contact a customer care representative?
Please visit Contact Us and select your state of residence to view the contact information for your area.
Contact Usverify your address.


Direct Energy
-
Electricity
Texas Electricity Plans for Your Home
Manage Your Existing Account
- Log Into My Account
- Direct Your Energy Usage Insights
- Renew Your Plan
- Transfer Your Service
- Amazon Alexa
Texas Energy Plans for Your Business

Pay Your Bill
Pay your bill the way you want: online, in person, by phone, or through the mail. You can even pay though your Amazon Echo Dot with the Direct Energy Skill. Or, sign up for Auto Pay and never miss a payment again.
Pay Your Bill -
Home Protection
Protect and Preserve Your Home
Services for Your Business
Don't Face Household Breakdowns Alone
Our home protection products cover all the appliances and home systems you count on every day, plus a network of expert technicians who will be there when you need them.
Learn More
-
Learn
Enrich Your Home Through Energy Education
Energy Education For Your Business
About the Learning Center
The Direct Energy Learning Center is your trusted source for a wide range of home-related topics such as energy efficiency, energy safety tips, weather preparedness, and more
Learn MoreThe Live Brighter Blog
From energy efficiency tips, recipes, and décor, to home maintenance or weather preparation, Direct Energy has content to enrich your everyday life.
Read More - Sign Up
-
Call Us: 1-855-461-1926
Call To Order:
1-855-461-1926 Hours: 7:00am-8:00pm CT Monday-Saturday
Customer Service:
1-866-348-4193 Hours: 7:00am-8:00pm CT Monday-Saturday -
Log In
 Forgot Username? Forgot Password? First Time User? Create an Account Business account? Sign in to MyAccount

